
You must log in or register to comment.
Let’s zoom out a bit to 5 years:

That last spike doesn’t look that dramatic anymore.
Right below this chart in OPs link is an article about nuclear energies demand…
Currently, approximately 190 million pounds of uranium are consumed annually, while only around 130 million pounds are extracted from the ground, creating a supply deficit.
Assuming OP is insinuating someone is building nukes… a quick Google says a nuclear war head uses about 30 pounds of uranium. That wouldn’t even be a footnote on the world scale, definitely not enough to drive global demand prices 10% over night
30 pounds of Uranium 235 which is 0.72% of natural uranium, so a bit more but still your point stands.
Anyone with the capacity to enrich uranium can probably also make plutonium, which is made from u238, so you really dont need that much. I belive you can chemically it separate as well.
I dont know about uranium, but is it traded like oil? Does the futures contract expire today and they only have so much left that can be sold in July, so they basically get to dictate the price at the end of the contract if there is more demand than supply? We saw a drastic squeeze on oil a few years back and it was back to normal in a day
Edit: it was actually the opposite for oil. They had too much to sell and no buyer because stores were full. They literally couldn’t give it away and prices went negative https://www.cnbc.com/2020/04/20/oil-markets-us-crude-futures-in-focus-as-coronavirus-dents-demand.html
Totally right. Tbh this OP guy is kinda whack. I’d take his posts with a grain of salt.
Yes, but he often brings interesting links which we can debate, so I appreciate that.
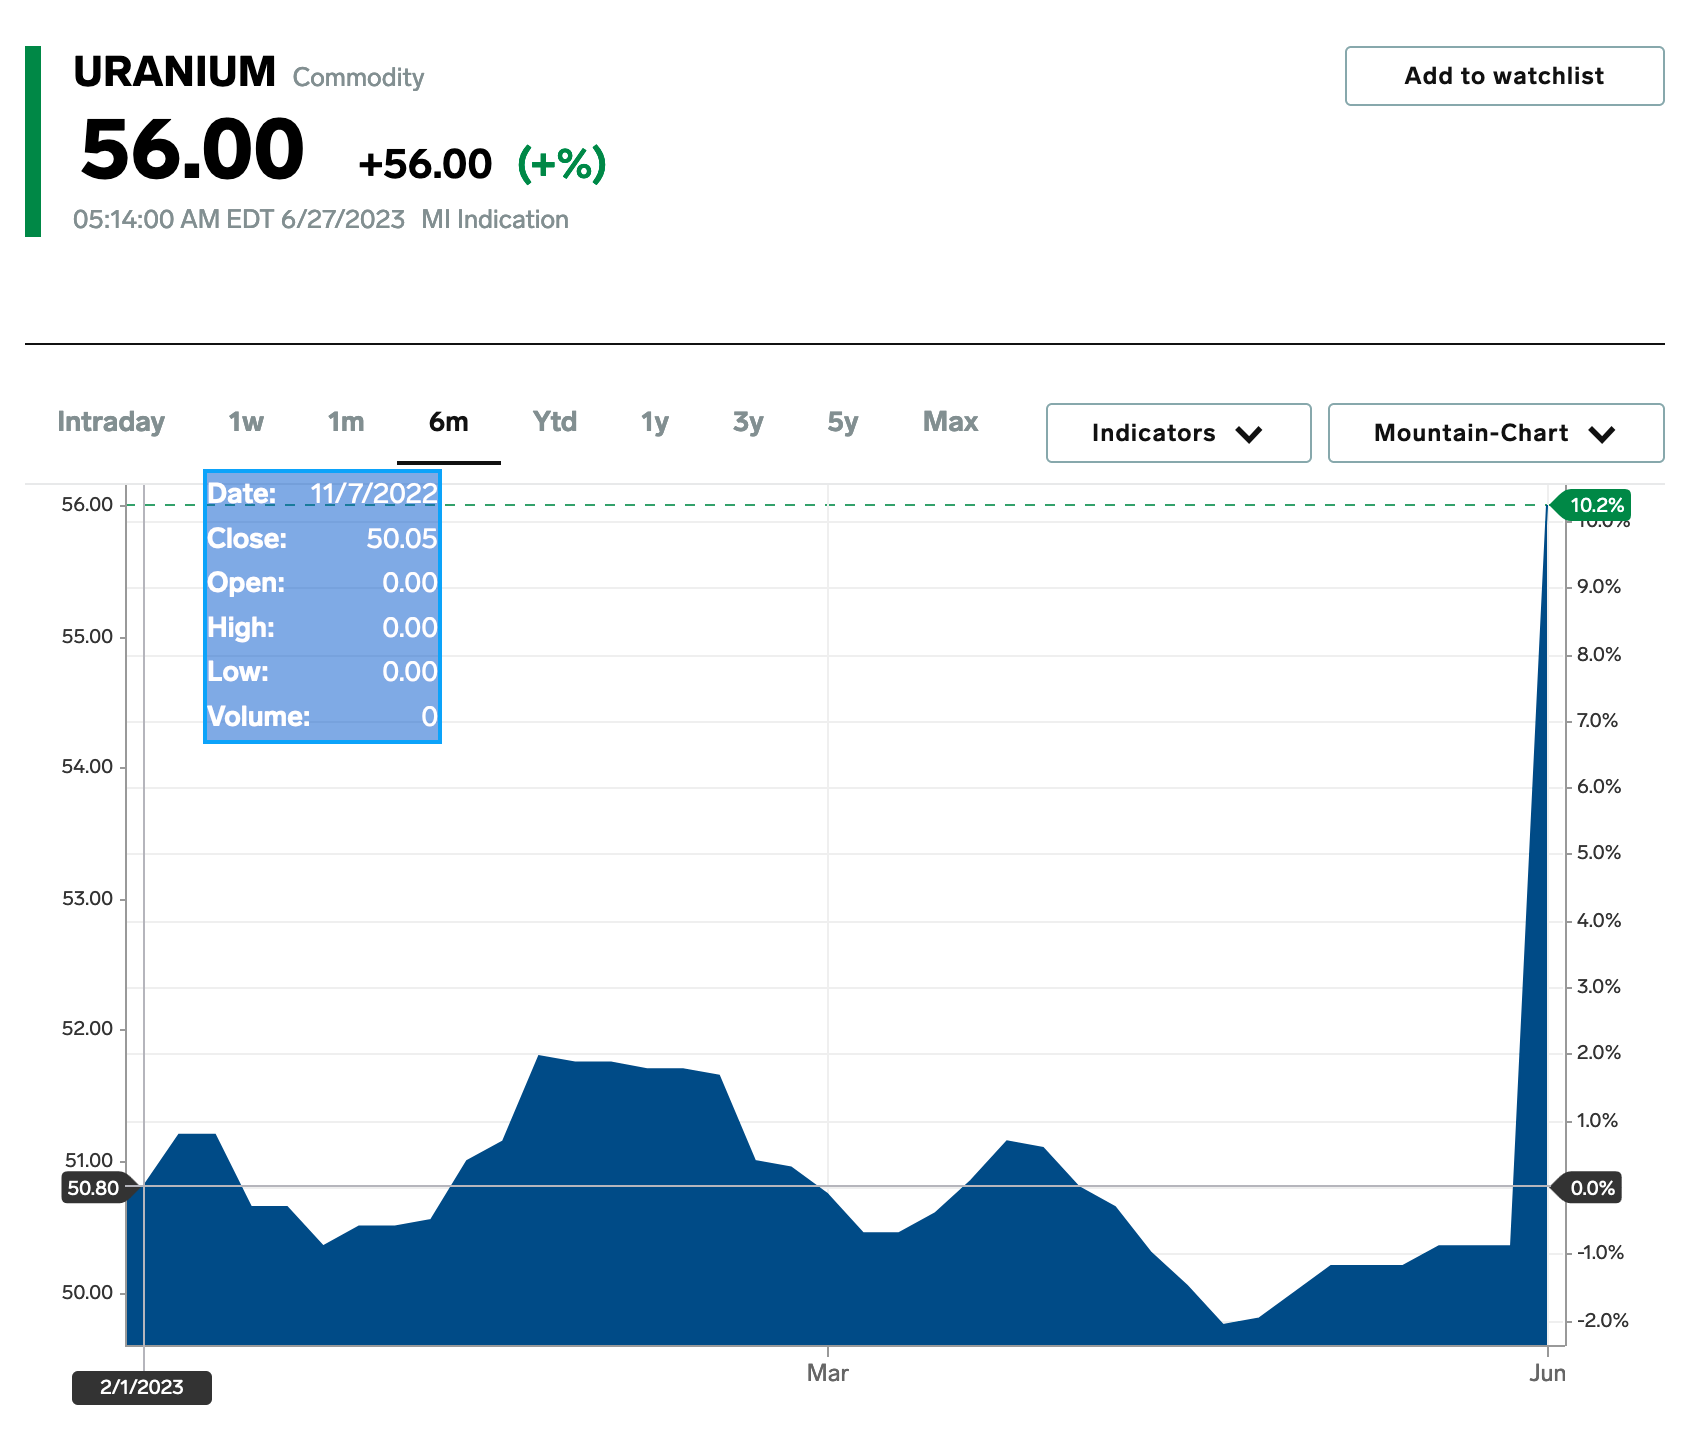
A 10% spike basically overnight is very obviously dramatic right now.
But we can see that it used to fluctuate much more before.
Anyway the spike is not ‘over night’ from what I can see it’s 3 months in between 3/28/2023 and 6/27/2023. The graph is very misleading, somehow the time axis is not linear, and also I’m getting different dates than you on that source website:


Yes, it has fluctuated before, I’m not sure why you keep bringing this up. Are you saying prior fluctuations did not have any impact on the market, energy production costs, and so on?
Meanwhile, three months is a pretty short timeline, and it’s likely to keep going up now that Niger is no longer exporting Uranium to France where there is high reliance on nuclear power. I’m also not sure what you’re saying is misleading bout the graph. I’m not really able to follow the point you’re trying to make there. Are you trying to say that Business Insider is somehow misrepresenting the data for some reason?
I’m just saying the graph is misleading because it changes the meaning of the X-axis significantly. In the screenshot it insinuates that it’s data of 6 months, but 95% of the graph is the first 3 months and the last 3 months for some reason are squized into the last 5% which makes it look like it was a spike over night as if something happened yesterday. Instead it might have been a gradual increase over the last 3 months, we don’t know because they have only one data point for the last 3 months while thy have 37 data points for the first 3 months of the graph.
I don’t know why they chose to arrange the data like that in the graph, but the relevance here is that Niger just said that they’re no longer going to export uranium to France where something like 75% of energy production comes from nuclear energy and Niger was one of the main suppliers.
It’s yog the propagandist. Literally every post he makes is easily countered with about 30 seconds of logic/history/reading the next page etc. He’s on multiple platforms doing the same thing. Always ragging on the west and pushing a russia/china narrative. One of the least intelligent/useful propagandists I’ve seen.
It’s just the war making Russian gas undesirable for meeting our (western world) energy needs causing our use of Uranium for nuclear reactors to skyrocket. This usage boost of course causes prices to rise. Especially since supply is limited. Factor in also that we’re moving towards winter time and we have the explanation for the recent spike, nations competing trying to fill their stockpiles.
Russia is one of the major uranium producers, and it’s where France has been importing a lot of the fuel from.
Yep, but people in general only know Gas = Russia. So to keep buying uranium isn’t as politically risky.
yeah that’s very true
6months means nothing
demand rose and supply dropped
