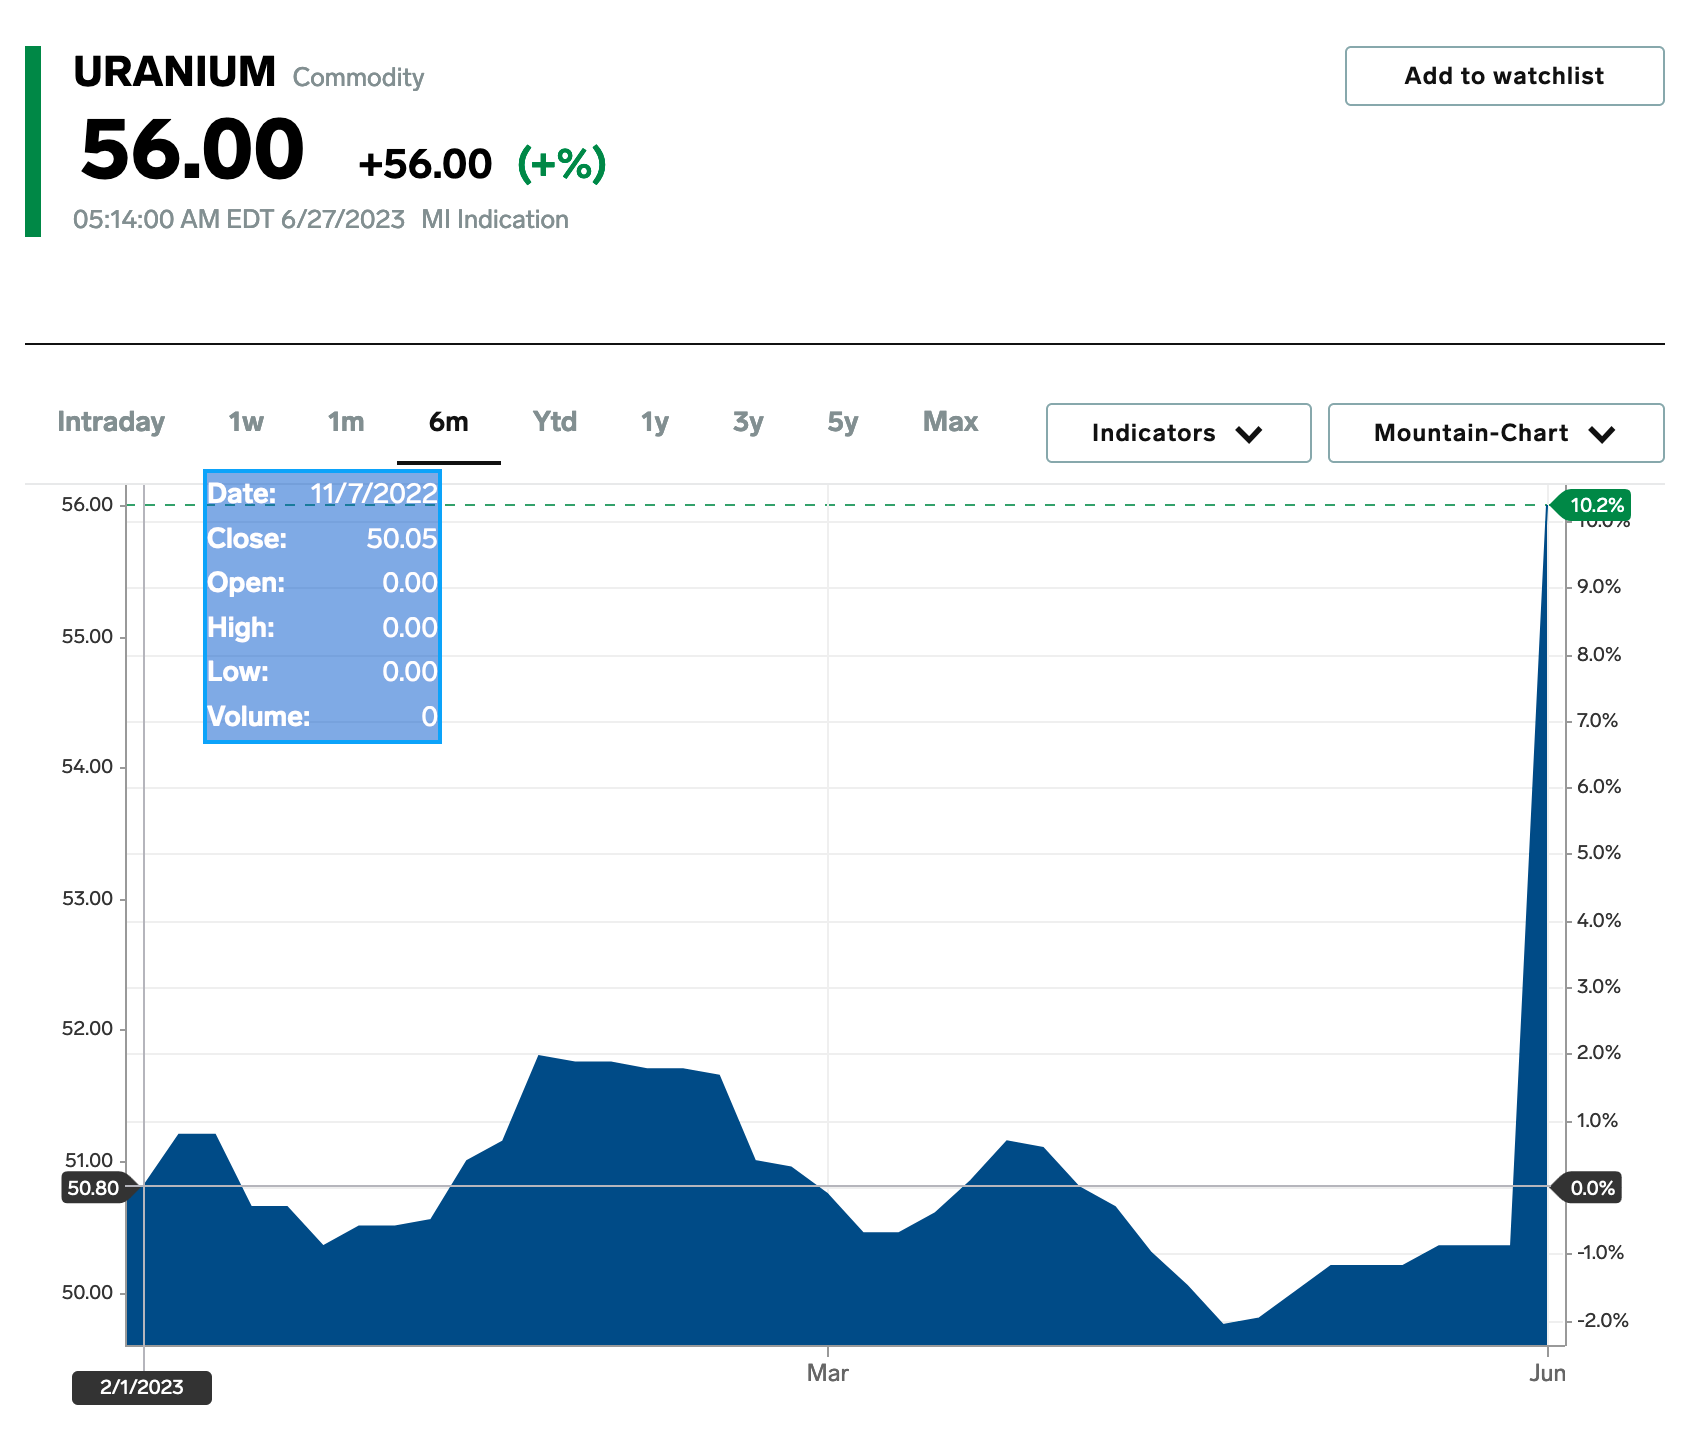
But we can see that it used to fluctuate much more before.
Anyway the spike is not ‘over night’ from what I can see it’s 3 months in between 3/28/2023 and 6/27/2023. The graph is very misleading, somehow the time axis is not linear, and also I’m getting different dates than you on that source website:
Yes, it has fluctuated before, I’m not sure why you keep bringing this up. Are you saying prior fluctuations did not have any impact on the market, energy production costs, and so on?
Meanwhile, three months is a pretty short timeline, and it’s likely to keep going up now that Niger is no longer exporting Uranium to France where there is high reliance on nuclear power. I’m also not sure what you’re saying is misleading bout the graph. I’m not really able to follow the point you’re trying to make there. Are you trying to say that Business Insider is somehow misrepresenting the data for some reason?
I’m just saying the graph is misleading because it changes the meaning of the X-axis significantly. In the screenshot it insinuates that it’s data of 6 months, but 95% of the graph is the first 3 months and the last 3 months for some reason are squized into the last 5% which makes it look like it was a spike over night as if something happened yesterday. Instead it might have been a gradual increase over the last 3 months, we don’t know because they have only one data point for the last 3 months while thy have 37 data points for the first 3 months of the graph.
I don’t know why they chose to arrange the data like that in the graph, but the relevance here is that Niger just said that they’re no longer going to export uranium to France where something like 75% of energy production comes from nuclear energy and Niger was one of the main suppliers.