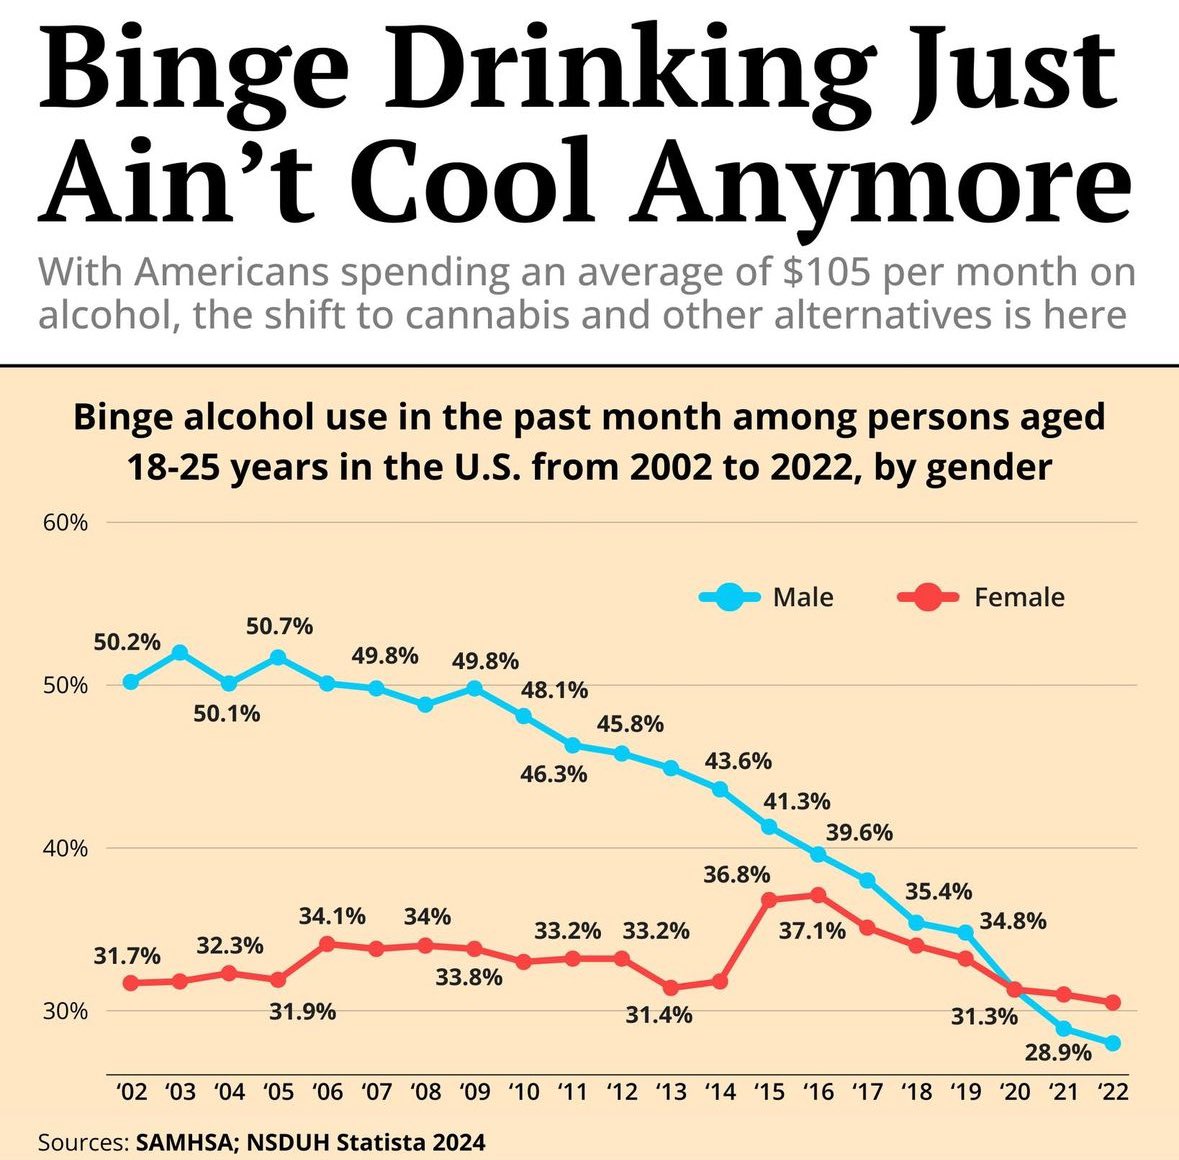
The Picard Maneuver@lemmy.world to Data is Beautiful@lemmy.worldEnglish · 3 months agoBinge alcohol use in the past month among persons aged 18-25 years in the U.S. from 2002 to 2022, by genderlemmy.worldimagemessage-square101fedilinkarrow-up1515arrow-down114
arrow-up1501arrow-down1imageBinge alcohol use in the past month among persons aged 18-25 years in the U.S. from 2002 to 2022, by genderlemmy.worldThe Picard Maneuver@lemmy.world to Data is Beautiful@lemmy.worldEnglish · 3 months agomessage-square101fedilink
minus-squareBlanketsWithSmallpox@lemmy.worldlinkfedilinkEnglisharrow-up2arrow-down1·edit-23 months ago the relevant reference points are 0% and (arguably) 100% … The relevant reference points are the ones in the graph which absolutely should be tailored to the dataset. Not ones you arbitrarily prefer. but cutting out half of the 0%-100% range means that the graphics are telling a different story than the labels are … Again, you deciding that the graph should be 0-100% is just… Pedantically dumb lol. It’s literally not misleading. You jumping to conclusions by really putting the ass in assumptions without reading is just bad comprehension skills.

… The relevant reference points are the ones in the graph which absolutely should be tailored to the dataset. Not ones you arbitrarily prefer.
… Again, you deciding that the graph should be 0-100% is just… Pedantically dumb lol.
It’s literally not misleading.
You jumping to conclusions by really putting the ass in assumptions without reading is just bad comprehension skills.