I’ve started encountering a problem that I should use some assistance troubleshooting. I’ve got a Proxmox system that hosts, primarily, my Opnsense router. I’ve had this specific setup for about a year.
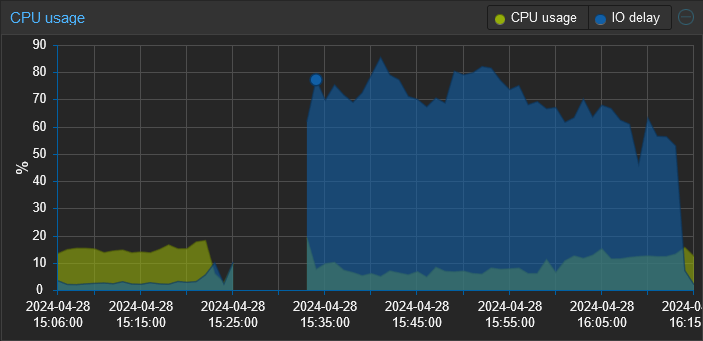
Recently, I’ve been experiencing sluggishness and noticed that the IO wait is through the roof. Rebooting the Opnsense VM, which normally only takes a few minutes is now taking upwards of 15-20. The entire time my IO wait sits between 50-80%.
The system has 1 disk in it that is formatted ZFS. I’ve checked dmesg, and the syslog for indications of disk errors (this feels like a failing disk) and found none. I also checked the smart statistics and they all “PASSED”.
Any pointers would be appreciated.

Edit: I believe I’ve found the root cause of the change in performance and it was a bit of shooting myself in the foot. I’ve been experimenting with different tools for log collection and the most recent one is a SIEM tool called Wazuh. I didn’t realize that upon reboot it runs an integrity check that generates a ton of disk I/O. So when I rebooted this proxmox server, that integrity check was running on proxmox, my pihole, and (I think) opnsense concurrently. All against a single consumer grade HDD.
Thanks to everyone who responded. I really appreciate all the performance tuning guidance. I’ve also made the following changes:
- Added a 2nd drive (I have several of these lying around, don’t ask) converting the zfs pool into a mirror. This gives me both redundancy and should improve read performance.
- Configured a 2nd storage target on the same zpool with compression enabled and a 64k block size in proxmox. I then migrated the 2 VMs to that storage.
- Since I’m collecting logs in Wazuh I set Opnsense to use ram disks for /tmp and /var/log.
Rebooted Opensense and it was back up in 1:42 min.


It could be a disk slowly failing but not throwing errors yet. Some drives really do their best to hide that they’re failing. So even a passing SMART test I would take with some salt.
I would start by making sure you have good recent backups ASAP.
You can test the drive performance by shutting down all VMs and using tools like fio to do some disk benchmarking. It could be a VM causing it. If it’s an HDD in particular, the random reads and writes from VMs can really cause seek latency to shoot way up. Could be as simple as a service logging some warnings due to junk incoming traffic, or an update that added some more info logs, etc.
I do.
Possible. It’s a really consistent (and stark) degradation in performance tho and is repeatable even when the opnsense VM is the only one running.